WP3·Streetscape and environmental analysis real data

Reading 99,100 street views.

The City's 2025 panoramas, read by open models and checked against a larger one.

360° panorama, 4000 × 2000 px
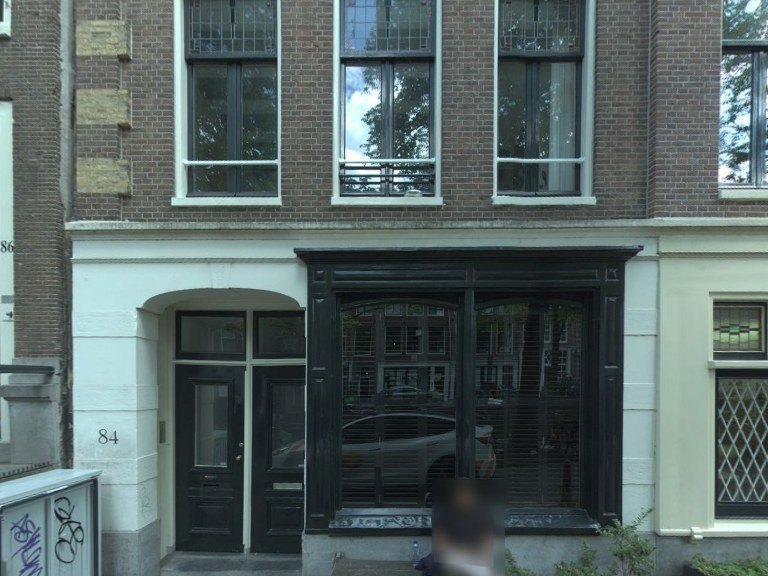
Front viewfront
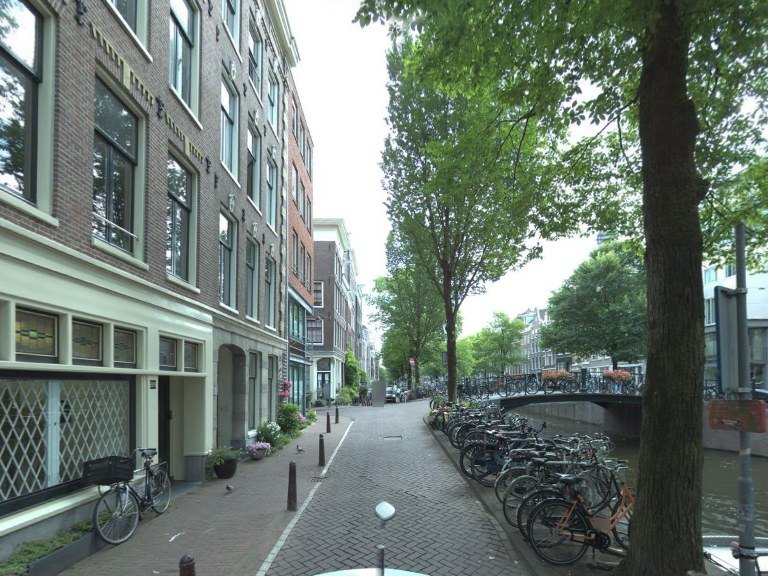
Right viewright
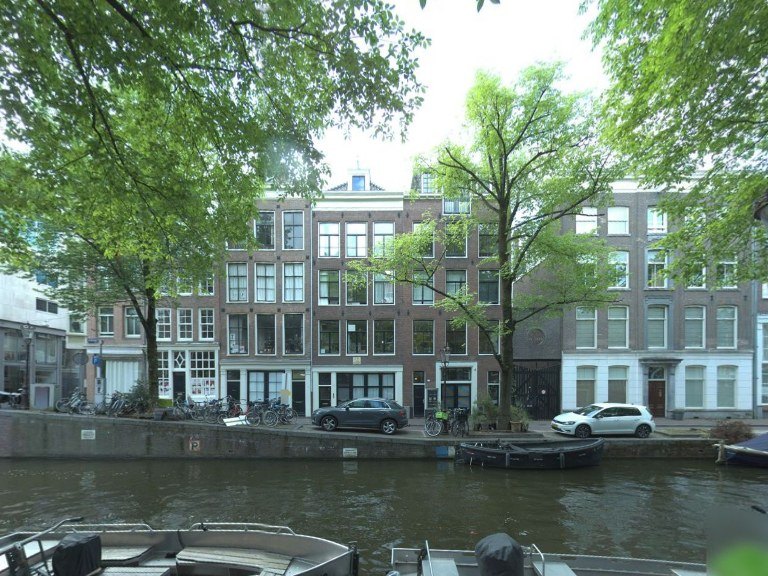
Back viewback
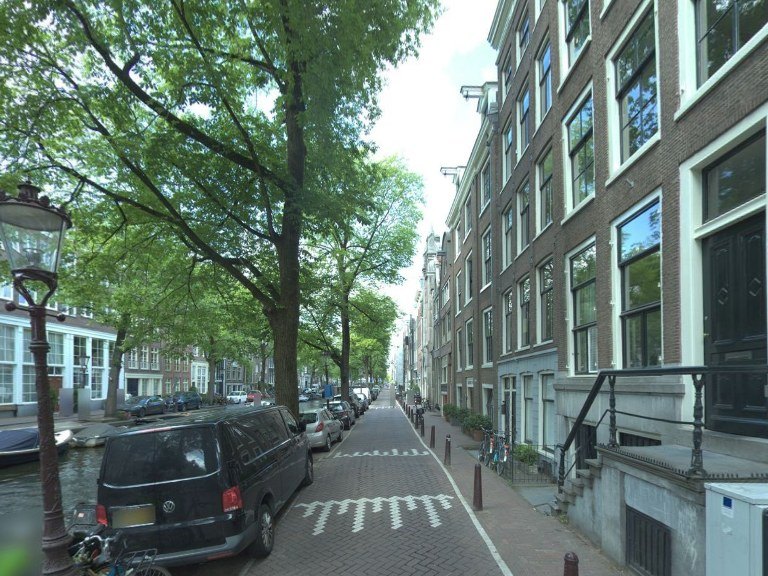
Left viewleft
Front view on the Bloemgracht, 3 July 2025

Hover a feature for the model's evidence.

01 / 07

24,775 panoramas.

From the City's camera car, June to October 2025: at most one per 50 m of street.

02 / 07

Into one street.

The Bloemgracht, on 3 July 2025.

03 / 07

One 360° image.

This is what the camera records: the whole street at once.

04 / 07

Cut into four views.

Ahead, right, behind, left. Four per panorama: 99,100 in all.

05 / 07

Nineteen questions per view.

An open model (Qwen3.5-4B) answers each with present, absent or not visible, and its evidence.

06 / 07

Checked by a larger model.

A 27B model re-read 500 views. Eight features agree well enough to map.

κ 0.77agreement on presence, all features
07 / 07

Street by street.

19,410 street segments: green view from segmentation, or walkability from the team's own perception model.

Now ask the images →

Perceived qualities

The team's own model, on every view.

Compare streets yourself →

22,637
ratings by 331 people in Amsterdam behind the model

ELEVATE's perception model comes from the team's Percept survey in Amsterdam (Danish et al. 2025) and is open. It scored all 99,100 views for walkability, bikeability, pleasantness, greenness and safety, from 1 to 5. Two Place Pulse models, trained outside Amsterdam, are kept as cross-checks. Its scores move with measures made without it: walkability separates views with and without a sidewalk (AUC 0.94), greenness follows the segmentation's green view (ρ 0.60 per panorama), and the Place Pulse cross-checks agree moderately (ρ 0.51–0.59).

Details
How far each feature can be trusted

Presence κ against Qwen3.8-27B-FP8 on 500 views (496 compared). Tier A ≥ 0.6, B 0.4–0.6, C < 0.4 (not used); rare: under 3% of views. The same 2,000 views audited twice gave the same state 96.2% of the time.

Where the 2025 archive sees the network

53% of the 4,813 km walk and cycle network lies within 12.5 m of a 2025 panorama; footways and paths only 8%.

Cross-check with segmentation

The bicycle class does not separate cycle infrastructure (AUC 0.50): the revised template does not count parked bicycles.